![]()

Introduction
Remember receiving report cards in school? These documents summarized your academic performance throughout the year. Traditionally, Excel, Word, or similar software were used to design them. But did you know you can create report cards using Python’s prettytable library? In this tutorial, you’ll learn to create a student report card in Python, making it an easy and fun process.
What is Prettytable?
PrettyTable is a Python library that helps create attractive ASCII tables from datasets. It offers an easy way to make tables with different formatting options like alignment, border styles, and column widths. It’s handy for showing tabular data neatly in command-line apps or text reports.
With PrettyTable, you can tweak table appearance to fit your requirements, making it a go-to tool for developers working on text-based interfaces or reports in Python.
Requirements
We’ll use the prettytable library, so ensure it’s installed before diving into the code:
pip install prettytable
Creating a Simple Report Card
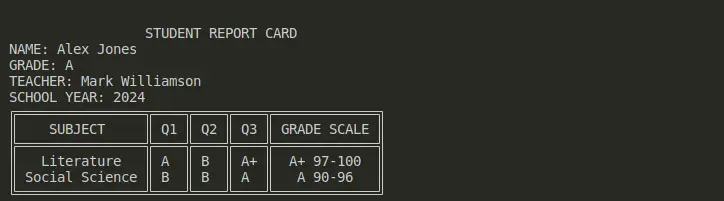
Let’s start by manually entering data into the code to construct a basic report card:
# Import the prettytable library for table formatting
from prettytable import PrettyTable, DOUBLE_BORDER

# Initialize a PrettyTable object and set styling
table = PrettyTable()
table.set_style(DOUBLE_BORDER)

# Student information
student_name = "Alex Jones"
year = 2021
grade_level = "A"
teacher_name = "Mark Williamson"

# Display heading with student information
print('\n')
print('                 STUDENT REPORT CARD                 ')
print('NAME:', student_name)
print('GRADE:', grade_level)
print('TEACHER:', teacher_name)
print('SCHOOL YEAR:', year)

# Define table headers
table.field_names = ["SUBJECT", "Q1", "Q2", "Q3", "GRADE SCALE"]

# Add rows with subject, grades, and corresponding letter grades
table.add_row(["Literature", "A", "B", "A+", "A+ 97-100"])
table.add_row(["Social Science", "B", "B", "A", "A 90-96"])
# ... (add remaining subject rows)

# Print the formatted table
print(table)
Output
Importing Data from a CSV File
Now, let’s import data from a CSV (The Sample File is here: report_card.csv) file instead of manually entering it:
# Import functions for reading and formatting CSV data
from prettytable import from_csv, DOUBLE_BORDER

# Open the CSV file and convert data into a PrettyTable object
with open("report_card.csv") as file:
    report_card_table = from_csv(file)

# Apply double border styling
report_card_table.set_style(DOUBLE_BORDER)

# Print the formatted table
print(report_card_table)
Output
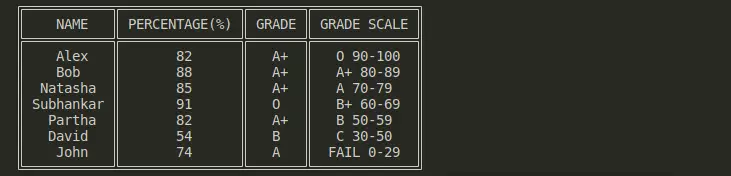
Sorting by a Specific Attribute
You can sort the report card data based on an attribute, like “PERCENTAGE”:
from prettytable import from_csv
from prettytable import DOUBLE_BORDER

# Open the CSV file and convert data into a PrettyTable object
with open("report_card.csv") as file:
    report_card_table = from_csv(file)

# Apply double border styling
report_card_table.set_style(DOUBLE_BORDER)

# Sort the table by the "PERCENTAGE" attribute (adjust as needed)
sorted_table = report_card_table.get_string(sortby="PERCENTAGE(%)")

# Print the sorted table
print(sorted_table)
Output

Replace “report_card.csv” with the actual filename of your CSV file and ensure the CSV file format matches your expected table structure. For more ideas, please explore prettytable documentation.
Summary
This tutorial explored how to generate student report cards in a table format using Python’s prettytable library. We covered manually entering data, importing data from a CSV file, and sorting the data by specific attributes.
I hope you found this tutorial helpful! Feel free to share your feedback and explore these additional Cool Python Programs:
- Censor Bad Words from a text: Profanity Filter in Python
- Image Cropping in Python 2024: Two Powerful Techniques
- Learn to Create Messi vs Ronaldo in Python
Happy Coding!